Every trader knows they need a stop loss. But most traders place their stop loss the wrong way — at a fixed number of points, a round number level, or simply wherever feels comfortable. And then they wonder why they get stopped out repeatedly on perfectly valid trades before the market moves in their direction.
The problem is not the trade. The problem is the stop.
In high-volatility markets like Nifty — where 200-point intraday swings are common and 500-point moves happen regularly — a fixed stop loss approach is fundamentally broken. The market’s natural noise alone is enough to hit your stop before your actual trade thesis plays out.
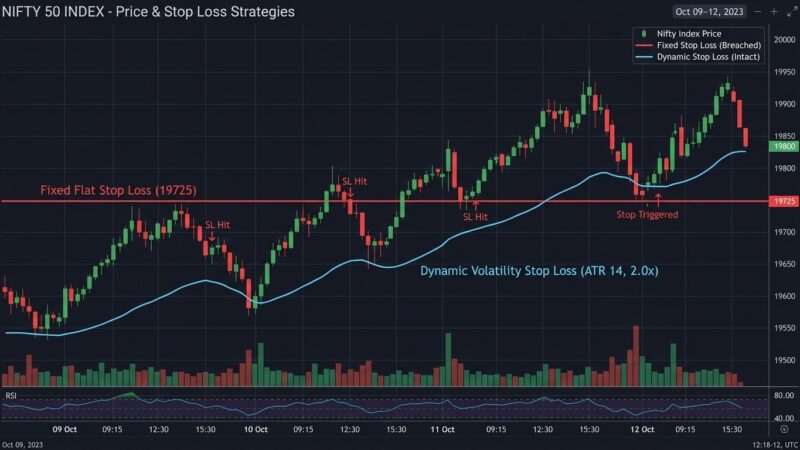
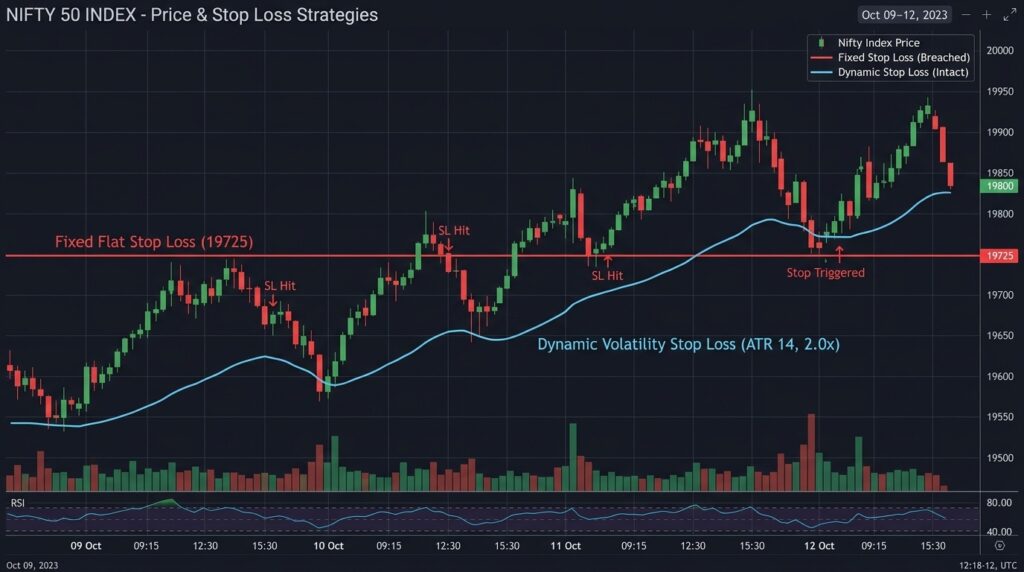
The solution is volatility-based stop loss — a method of placing stops that adapts to what the market is actually doing, rather than what you feel comfortable losing.
This article explains exactly what volatility-based stops are, how to calculate them using ATR, and how to apply them specifically in Nifty and high-volatility Indian markets.
Why Fixed Stop Losses Fail in High-Volatility Markets
To understand why volatility-based stops matter, first understand why fixed stops fail.
A fixed stop loss is one placed at a predetermined distance from entry — for example, always 50 points below entry on Nifty, or always 2% below the stock price. Simple, consistent, easy to apply.
The problem is that markets are not simple, consistent, or easy. Volatility changes constantly. On a calm day, Nifty might move 80 points total. On a high-volatility day — a budget announcement, RBI policy day, global news event — Nifty might move 400 to 600 points.
A 50-point fixed stop that works perfectly on a calm day will get hit multiple times on a high-volatility day simply due to normal market noise — before the actual directional move even begins.
Conversely, a stop that is wide enough to survive a high-volatility day will be unnecessarily large on a calm day — increasing your risk far beyond what the trade actually requires.
Fixed stops are calibrated to your comfort level. Volatility-based stops are calibrated to the market’s actual behavior.
That difference is everything.

What Is ATR — The Foundation of Volatility-Based Stops
The most widely used tool for measuring market volatility — and therefore for calculating volatility-based stops — is the Average True Range, commonly known as ATR.
ATR was developed by technical analyst J. Welles Wilder and introduced in his 1978 book on technical trading systems. It remains one of the most practically useful indicators in trading today — not because it predicts direction, but because it measures volatility objectively.
How ATR Is Calculated
ATR measures the average range of price movement over a specified number of periods. The “True Range” for any single period is the largest of these three values:
- Current High minus Current Low
- Current High minus Previous Close (absolute value)
- Current Low minus Previous Close (absolute value)
The third and second calculations account for gaps — situations where the market opens significantly above or below the previous close. This makes ATR a more accurate measure of true market movement than simply high minus low.
ATR is then the average of these True Range values over a specified lookback period — typically 14 periods, though this can be adjusted.
What ATR Tells You
If Nifty’s 14-period ATR on a daily chart is 180 points — it means that on average, Nifty moves 180 points per day when accounting for gaps and full intraday range.
This number is your baseline for understanding what is normal market noise versus what is a genuine directional move. Any stop loss placed closer than 1 ATR from your entry is likely to be hit by normal daily noise — regardless of whether your trade direction is correct.
How to Find ATR on Your Trading Platform
ATR is available on virtually every trading platform used in India.
On Zerodha Kite: Open any chart → Click Indicators → Search “ATR” → Add to chart. Set period to 14.
On TradingView: Click Indicators at top → Search “ATR” → Select Average True Range → Period 14 is default.
On Upstox Pro: Chart → Indicators → ATR → Apply.
Once added, ATR appears as a line below your main chart showing the current average true range value. On Nifty’s daily chart, this number is typically between 120 and 300 points depending on current market conditions.
The ATR Stop Loss Formula
Once you have your ATR value, calculating a volatility-based stop is straightforward.
Basic ATR Stop Formula:
Stop Loss Distance = ATR Value × MultiplierFor Long Trade:
Stop Loss Price = Entry Price − (ATR × Multiplier)For Short Trade:
Stop Loss Price = Entry Price + (ATR × Multiplier)The multiplier is the key variable. Common multiplier values are:
| Multiplier | Use Case |
|---|---|
| 1.0× ATR | Tight stop — scalping, very short-term trades |
| 1.5× ATR | Standard stop — intraday swing trades |
| 2.0× ATR | Normal stop — most recommended for Nifty intraday |
| 2.5× ATR | Wide stop — positional trades, trending markets |
| 3.0× ATR | Very wide stop — swing trades, weekly timeframe |
The 2.0× ATR multiplier is the most commonly recommended starting point for Nifty intraday trading because it provides enough room for normal market noise while still defining clear risk.
Practical Examples on Nifty
Example 1 — Nifty Intraday Long Trade
- Nifty current ATR (14-period, 15-minute chart): 85 points
- Entry: 22,400
- Multiplier: 2.0×
- Stop Loss Distance: 85 × 2 = 170 points
- Stop Loss: 22,400 − 170 = 22,230
Compare this to a trader using a fixed 50-point stop at 22,350. On a day when ATR is 85 points, a 50-point stop will almost certainly be hit by normal noise — even if the trade direction is correct.
Example 2 — Nifty on High Volatility Day (Budget Day)
- Nifty ATR spikes to 220 points (budget/event day)
- Entry: 22,400
- Multiplier: 2.0×
- Stop Loss Distance: 220 × 2 = 440 points
- Stop Loss: 22,400 − 440 = 21,960
Notice what happened — on a high-volatility day, the ATR-based stop automatically widens. This is the system protecting you from being shaken out by the extreme noise that accompanies major market events.
The wider stop also means your position size must decrease to keep risk at 1%. This is the volatility-based system working correctly — high volatility means wider stop means smaller position size means same rupee risk.
Example 3 — Bank Nifty Short Trade
- Bank Nifty ATR (14-period, 5-minute chart): 95 points
- Entry: 48,200 (short)
- Multiplier: 1.5× (tighter — scalp trade)
- Stop Loss Distance: 95 × 1.5 = 142.5 points
- Stop Loss: 48,200 + 142.5 = 48,342.5 → round to 48,345
Choosing the Right ATR Period and Timeframe
The ATR period and chart timeframe you use should match your trading style.
For Intraday Traders
Use ATR on the same timeframe you trade. If you trade on a 15-minute chart — calculate ATR on the 15-minute chart. A 14-period ATR on a 15-minute chart gives you the average range of the last 14 candles — approximately 3.5 hours of recent market behavior.
For very short-term intraday trades, some traders prefer a shorter ATR period of 7 or 10 to make it more responsive to recent volatility changes.
For Swing Traders
Use ATR on the daily chart. A 14-period daily ATR gives you the average daily range over the past 14 trading sessions — a reliable measure of current market volatility for multi-day positions.
For Positional Traders
Use ATR on the weekly chart for the broadest view of volatility. Weekly ATR-based stops give positions enough room to survive normal corrections without being stopped out prematurely.
The Chandelier Exit — Advanced Volatility-Based Stop
The Chandelier Exit is a more sophisticated volatility-based stop system that is particularly useful for trend-following trades. It was popularized by Charles Le Beau and is widely used by professional traders.
Chandelier Exit Formula:
For Long Positions:
Chandelier Stop = Highest High of last N periods − (ATR × Multiplier)

For Short Positions:
Chandelier Stop = Lowest Low of last N periods + (ATR × Multiplier)
Typical settings: N = 22 periods, Multiplier = 3.0×
The key difference from a simple ATR stop is that the Chandelier Exit trails upward as the trade moves in your favor — locking in profits as price rises — while expanding the stop distance based on current ATR. It only moves in the direction of the trade — never against it.
This makes it particularly effective for capturing large Nifty trending moves while protecting profits accumulated during the trend.
The Chandelier Exit is available as a built-in indicator on TradingView — search “Chandelier Exit” in the indicators panel.
Combining Volatility-Based Stops With Key Levels
Pure ATR stops are powerful but become even more effective when combined with technical price levels.
The professional approach is to use ATR as a minimum stop distance and then adjust to the nearest significant technical level beyond that distance.
Example:
- ATR-based stop calculation gives you a stop at 22,230
- Nearest significant support level is at 22,180
- Place stop at 22,170 — just below the support level — which is slightly wider than the pure ATR stop
This way your stop respects both the market’s volatility and the technical structure. You are not stopped out by normal noise AND you are not stopped out by a false break of a minor level.
If the ATR calculation suggests a stop at 22,230 but the nearest support is far away at 21,900 — that is important information. It tells you that this trade requires either a very wide stop or a smaller position size to keep risk within your 1% limit. Sometimes the right answer is not to take the trade at all if the required stop makes the risk-reward ratio unattractive.
Volatility-Based Stops and Position Sizing — They Work Together
This is the part most traders miss. Volatility-based stops and position sizing are not separate concepts — they are a single integrated system.
When ATR is high and your stop is wide — your position size must decrease to maintain the same rupee risk. When ATR is low and your stop is tight — your position size can increase while maintaining the same rupee risk.
The formula:
Position Size = Rupee Risk ÷ Stop Loss Distance (in points × lot value)Example with Nifty Futures (lot size 25):
Scenario A — Low Volatility Day:
- Account: ₹5,00,000
- 1% Risk: ₹5,000
- ATR: 80 points, Stop: 80 × 2 = 160 points
- Value per point per lot: ₹25
- Stop value per lot: 160 × 25 = ₹4,000
- Position Size: ₹5,000 ÷ ₹4,000 = 1 lot
Scenario B — High Volatility Day:
- Account: ₹5,00,000
- 1% Risk: ₹5,000
- ATR: 200 points, Stop: 200 × 2 = 400 points
- Value per point per lot: ₹25
- Stop value per lot: 400 × 25 = ₹10,000
- Position Size: ₹5,000 ÷ ₹10,000 = 0.5 lots → round down to 0 lots
In Scenario B — the system is telling you something important: on this high-volatility day, you cannot trade even one Nifty lot and keep risk within 1% of your account. The correct action is to not trade — or to use options instead where you can define risk precisely.
This is not a failure of the system. This is the system working exactly as designed — protecting you from taking oversized risk on high-volatility days when most traders make their biggest mistakes.

Common Mistakes When Using Volatility-Based Stops
Mistake 1 — Using Daily ATR for Intraday Trades
Daily ATR on Nifty might be 180 points. But if you are trading on a 5-minute chart, using a 180-point stop is absurd — it is far too wide for an intraday trade. Always match your ATR timeframe to your trading timeframe.
Mistake 2 — Ignoring ATR Spikes on Event Days
On RBI policy days, budget announcements, or major global events — ATR spikes dramatically. Many traders continue using their normal stop distances on these days without realizing ATR has doubled or tripled. Check ATR before every trading session — especially on known event days.
Mistake 3 — Moving the Stop Further When Hit
Volatility-based stops tell you where your stop should be based on market conditions. If price is approaching your stop and you widen it — you have just overridden the entire system. The stop is placed where it is for a specific reason. Respect it.
Mistake 4 — Using the Same Multiplier for All Market Conditions
A 2.0× ATR multiplier may work well in normal trending markets but may need adjustment during extremely choppy, range-bound conditions where even a 2× stop gets hit repeatedly. In range-bound Nifty, consider either waiting for clearer setups or temporarily using a tighter 1.5× multiplier with reduced position size.
Mistake 5 — Forgetting to Adjust Position Size With Stop Width
This is the most financially dangerous mistake. If your ATR-based stop is twice as wide as your usual fixed stop — but you keep the same position size — you have doubled your risk. Volatility-based stops only work as a complete system when paired with proportional position sizing adjustments.
A Simple Daily Checklist for Volatility-Based Stop Placement
Before placing any trade on Nifty or Bank Nifty, run through this checklist:
Step 1 — Check current ATR on your trading timeframe. Is it normal, elevated, or spiking?
Step 2 — Calculate your ATR-based stop distance using 2.0× multiplier as starting point.
Step 3 — Identify the nearest significant technical level beyond your ATR stop. Adjust stop to just beyond that level if applicable.
Step 4 — Calculate your position size based on your 1% rupee risk divided by the stop distance.
Step 5 — If the required position size is less than 1 lot — consider whether this trade is worth taking or wait for better conditions.
Step 6 — Place the trade with stop loss entered simultaneously. No exceptions.
Final Thoughts
Most traders lose money not because they pick the wrong direction — but because they get stopped out of the right direction by stops that are too tight for market conditions.
Volatility-based stops solve this problem by making your risk management dynamic and responsive to what the market is actually doing — rather than static and calibrated to your personal comfort level.
In high-volatility Indian markets like Nifty and Bank Nifty — where institutional algorithms, global cues, and event-driven moves create wide and unpredictable intraday swings — a fixed stop loss approach is genuinely dangerous. ATR-based stops give your trades the room they need to work while still defining clear, calculated risk.
Learn to read ATR. Apply the formula consistently. Adjust your position size every time your stop width changes. And stop letting the market’s natural noise shake you out of trades that were right all along.
That adjustment — from fixed stops to volatility-based stops — will immediately improve the quality of your trade execution and the consistency of your results.