Every beginner in trading and investing has heard the same advice: diversify your portfolio. Do not put all your eggs in one basket. Spread your money across multiple stocks. Buy different sectors. This way, if one stock falls, the others will protect you.
This advice is not wrong. But it is dangerously incomplete.
Because there is a hidden risk that diversification alone cannot protect you from — and most retail traders in India have never heard of it. It is called correlation risk. And understanding it could be the difference between a portfolio that actually survives market downturns and one that looks diversified on paper but crashes together when it matters most.
What Is Correlation Risk in Trading?
Correlation risk is the risk that comes from holding multiple assets that move together in the same direction — even though they appear to be different investments.
In statistics, correlation is measured on a scale from -1 to +1:
- +1 (Perfect Positive Correlation) — Two assets move in exactly the same direction, by the same amount, at the same time
- 0 (Zero Correlation) — Two assets have no relationship with each other
- -1 (Perfect Negative Correlation) — Two assets move in exactly opposite directions
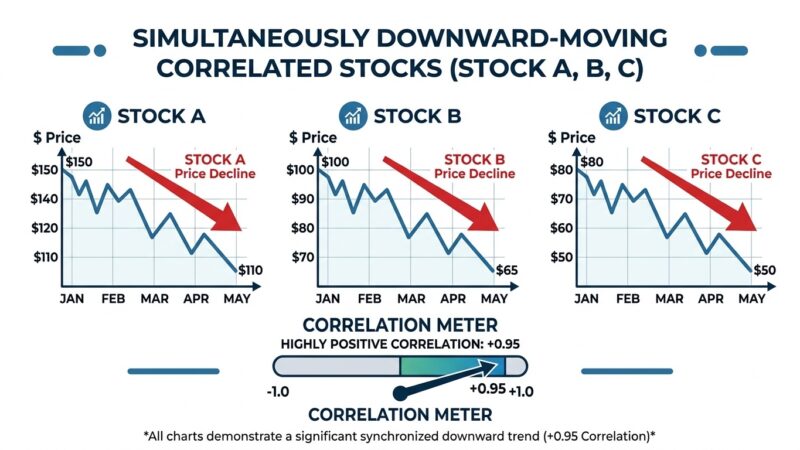
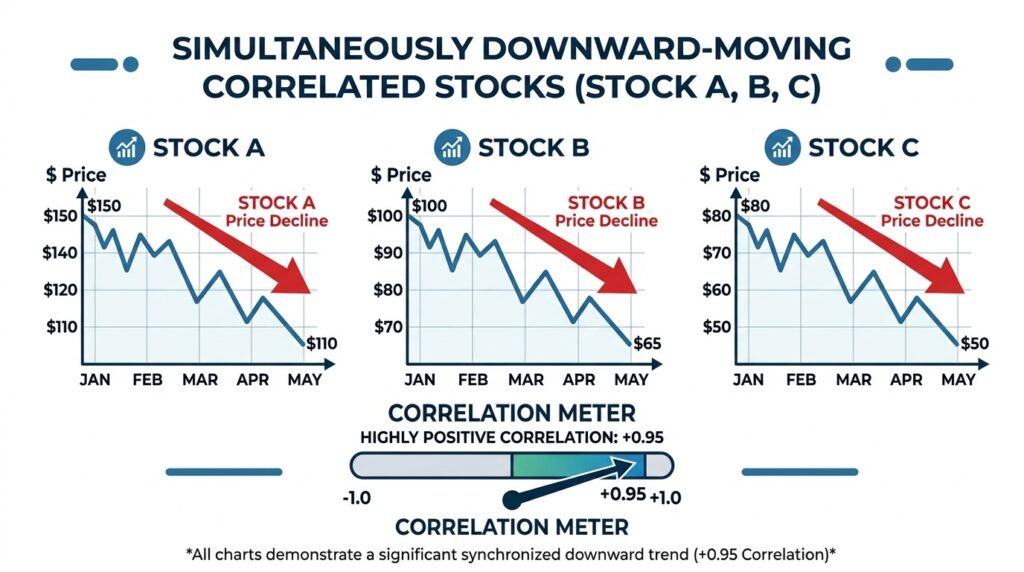
The problem most traders face is this: they build a portfolio of 8 to 10 different stocks, feel confident they are diversified, and then watch every single stock fall simultaneously during a market downturn.
This happens because those stocks — despite being from different companies — are highly correlated. They move together. And when the broader market sells off, correlation between most stocks spikes dramatically — often approaching +1.
Diversification only works when your assets are not correlated. When they are correlated, diversification becomes an illusion.
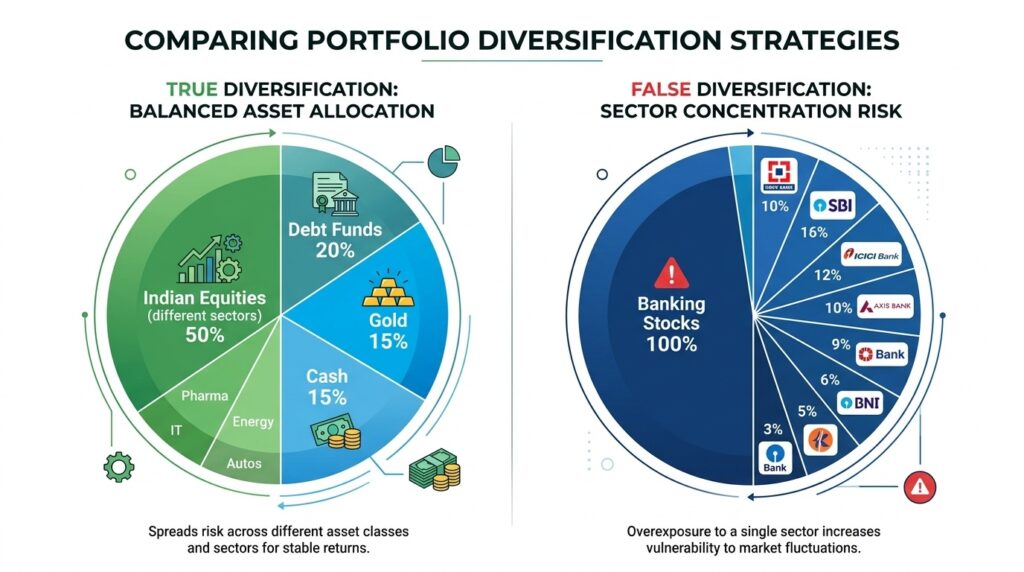
The Classic Indian Trader Mistake — Sector Concentration
Here is the most common real-world example of correlation risk among Indian traders:
A trader decides to diversify their portfolio. They buy:
- HDFC Bank
- ICICI Bank
- Axis Bank
- Kotak Mahindra Bank
- SBI
Five different stocks. Five different companies. Feels diversified, right?
It is not.
All five stocks belong to the banking sector. They are all affected by the same macroeconomic factors — RBI interest rate decisions, credit growth data, NPA levels, liquidity conditions. When RBI raises rates unexpectedly or banking sector news turns negative, all five stocks fall together — often on the same day, at the same time, by similar percentages.
The trader has not diversified risk. They have concentrated it — just across five different names instead of one.
This is sector correlation risk. And it is extremely common in Indian retail portfolios because traders tend to buy stocks they know and understand — and they usually know one or two sectors well.
Why Correlation Spikes During Market Crashes
Here is the most dangerous aspect of correlation risk — and the one that catches even experienced traders off guard:
During normal market conditions, correlations between stocks can be moderate — around 0.3 to 0.6. During market crashes, correlations spike toward 0.9 to 1.0 across almost all stocks.
This means that diversification appears to work during calm markets — because stocks move somewhat independently. But the moment you need diversification most — during a crash — it stops working. Everything falls together.
This phenomenon is well documented in financial research and has been observed in every major market crash — the 2008 global financial crisis, the March 2020 COVID crash, and every significant Indian market correction.
The reason this happens is psychology. When fear dominates markets, investors do not carefully sell only their worst positions. They sell everything — across all sectors, all asset classes, all geographies — to raise cash and reduce risk. This mass selling creates simultaneous declines across all correlated assets.
For a trader holding a “diversified” portfolio of Indian stocks, a market-wide crash means every single position goes red at the same time — regardless of how many different companies or sectors are represented.
Real World Example — March 2020 COVID Crash in India
The Nifty 50 fell approximately 38% between January and March 2020 in less than 8 weeks.
During this period, the correlation between stocks across all sectors — IT, pharma, banking, FMCG, auto, metals — spiked dramatically. Stocks that had shown low correlation during the preceding bull market suddenly fell together.
A trader who had carefully built what appeared to be a well-diversified portfolio across 10 different sectors watched every single position decline simultaneously. Their “diversification” provided almost no protection because correlation risk — which they had never measured or managed — wiped out the theoretical benefit of holding different stocks.
The only positions that genuinely protected capital during this period were those with true negative or zero correlation to equity markets — such as gold, certain government bonds, and cash.
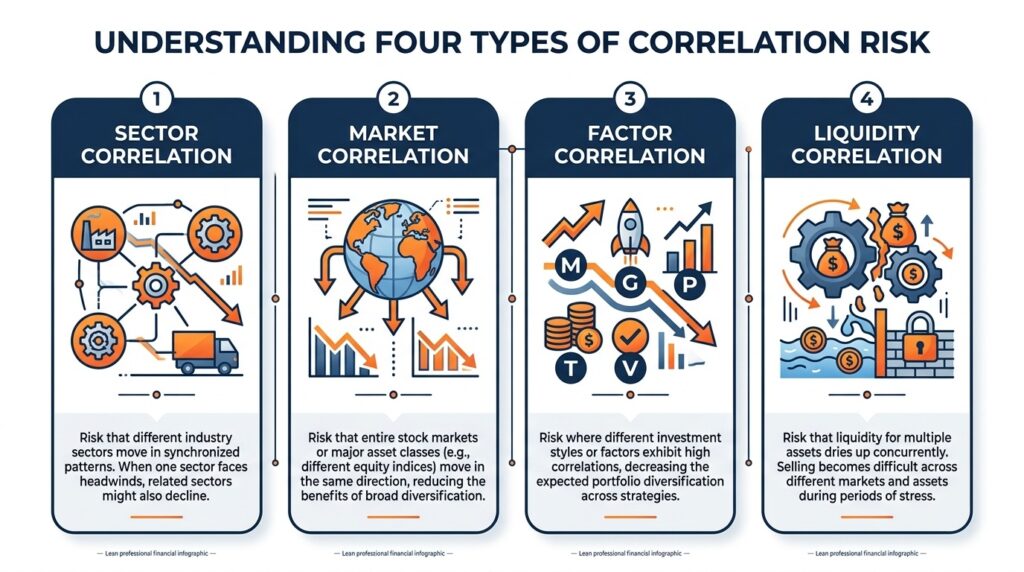
Types of Correlation Risk Every Trader Should Know
1. Sector Correlation
Assets within the same sector are highly correlated because they share the same business drivers, regulatory environment, and economic sensitivity. Banking stocks move together. IT stocks move together. Auto stocks move together.
How to identify it: If all your stocks would be affected by the same single piece of news — you have sector correlation risk.
2. Market Correlation
Most Indian stocks have high correlation with the Nifty 50 index. When the broader market falls, individual stocks — regardless of their sector — tend to fall with it. This is market beta risk combined with correlation risk.
How to identify it: Check the beta of each stock in your portfolio. If all stocks have beta above 1.0, your entire portfolio amplifies market moves in both directions.
3. Factor Correlation
Some stocks that appear to be in different sectors are actually driven by the same underlying factor. For example — IT stocks and export-oriented pharma companies are both heavily influenced by the USD/INR exchange rate. A rupee appreciation hurts both simultaneously — even though they appear unrelated.
How to identify it: Think about what macroeconomic factors drive each stock. If two “different” stocks share a major driver — they are correlated through that factor.
4. Liquidity Correlation
During severe market stress, liquidity dries up across all assets simultaneously. Stocks that were previously uncorrelated become correlated simply because all sellers are trying to exit at the same time and there are no buyers.
This is the most unpredictable form of correlation risk and the hardest to hedge against.
How to Measure Correlation in Your Portfolio
You do not need a Bloomberg terminal or advanced mathematics to measure correlation in your portfolio. Here is a practical approach for Indian retail traders.
Method 1 — Visual Chart Comparison
The simplest method. Open charts of two stocks you hold side by side on the same timeframe. Do they move in similar patterns? Do they peak and trough at approximately the same times? If yes — they are likely highly correlated.
This is not precise but gives you a quick visual indication of whether two holdings move together.
Method 2 — Excel Correlation Formula
If you have price data for two stocks, Excel can calculate their correlation in seconds.
- Download daily closing price data for both stocks from NSE website for the past 6 to 12 months
- In Excel, use the formula:
=CORREL(A2:A252, B2:B252)where Column A is Stock 1 prices and Column B is Stock 2 prices - The result will be a number between -1 and +1
- Anything above 0.7 indicates high positive correlation — these two stocks are likely to move together significantly
Method 3 — Sector Analysis
The quickest practical check. Simply ask: are these two stocks in the same sector or driven by the same macroeconomic factor?
If yes — assume high correlation and treat them as partially the same position for risk management purposes.
How to Actually Reduce Correlation Risk — Practical Strategies
Strategy 1 — True Sector Diversification
Do not just hold stocks from different companies. Hold stocks from genuinely different sectors with different economic drivers.
A truly diversified Indian equity portfolio might include exposure to IT (driven by global tech demand and USD), FMCG (driven by domestic consumption), pharma (driven by healthcare demand and exports), infrastructure (driven by government spending), and commodities (driven by global prices).
These sectors have meaningfully different drivers — which reduces — though does not eliminate — correlation during normal market conditions.
Strategy 2 — Include Non-Correlated Asset Classes
True diversification requires assets that have low or negative correlation with equities. For Indian investors, these include:
Gold — Historically shows low to negative correlation with Indian equities during market stress. When stocks fall sharply, gold often holds value or rises. Sovereign Gold Bonds or Gold ETFs provide easy access.
Debt instruments — Government bonds and high-quality debt funds typically show low correlation with equity markets. During equity market stress, capital often flows into safe debt instruments.
Cash — Holding a portion of your trading capital in cash is itself a risk management strategy. Cash has zero correlation with any market. It also gives you the ability to deploy capital at better prices after a correction.
Strategy 3 — Limit Single Sector Exposure
Set a maximum allocation rule for any single sector. For example: no more than 20-25% of portfolio in any one sector. This forces genuine diversification and prevents the accidental sector concentration that most Indian retail portfolios suffer from.
Strategy 4 — Monitor Correlation During Changing Market Conditions
Correlations are not static. They change as market conditions change. A pair of stocks that showed 0.4 correlation during a bull market might show 0.9 correlation during a bear market.
Review your portfolio’s correlation structure every quarter — especially when broader market conditions shift significantly. What worked as diversification in a bull market may not provide the same protection in a bear market.
Strategy 5 — Use Hedges for High-Correlation Periods
When you identify that your portfolio is highly correlated to the broader market and you expect market volatility — consider partial hedges. This could include buying put options on Nifty, reducing overall position size, or increasing cash allocation temporarily.
Hedging is not about eliminating all risk. It is about reducing the impact of correlation spikes during market stress.
The Uncomfortable Truth About Diversification
Here is what most financial content does not tell you:
No amount of diversification within a single asset class can fully protect you from a systemic market crash.
When the entire market sells off — as it did in 2008, in 2020, and as it will again in future crises — correlation across all stocks spikes. Diversification within equities provides limited protection precisely when you need protection most.
This is not an argument against diversification. It is an argument for understanding what diversification can and cannot do.
Diversification across different stocks within the same asset class reduces stock-specific risk — the risk that one particular company performs badly due to its own problems. This is genuine and valuable.
But it does not reduce systematic risk — the risk that the entire market declines due to macroeconomic factors, global crises, or broad investor panic. For systematic risk, you need assets with genuinely low or negative correlation to equities — not just more stocks.
Understanding this distinction is the difference between a trader who is genuinely protected and one who only believes they are protected.
Correlation Risk Checklist for Indian Traders
Before considering your portfolio diversified, ask these questions:
- Do I hold stocks from at least 4 to 5 genuinely different sectors with different economic drivers?
- Does any single sector represent more than 25% of my total portfolio?
- Do I have any allocation to assets with low correlation to Indian equities — gold, debt, or cash?
- Have I checked whether my “different” stocks are actually driven by the same macroeconomic factor?
- Does my portfolio have a plan for what happens during a broad market correction — not just individual stock declines?
If you cannot answer yes to most of these questions — your portfolio likely has more correlation risk than you realize.
Final Thoughts
Correlation risk is one of the most sophisticated — and most overlooked — concepts in retail trading and investing. It explains a phenomenon that confuses many traders: why did my diversified portfolio fall just as much as the market during the last crash?
The answer is almost always correlation. The stocks looked different on paper but moved together when it mattered.
True risk management is not just about holding many stocks. It is about understanding how those stocks relate to each other — and ensuring that your diversification is real, not just numerical.
Build a portfolio where your positions genuinely do not all move in the same direction at the same time. Include assets with different drivers. Monitor your correlations as market conditions change. And always maintain some allocation to truly uncorrelated assets — gold, debt, or cash.
That is not just diversification. That is genuine risk management.