Many beginners learn dozens of candlestick patterns, yet they still lose money. The reason is simple: they memorize patterns but do not understand candlestick patterns that work in real market conditions.
Candlestick patterns are not magic signals. They work only when used with context, support–resistance, and proper risk management. This article explains only those candlestick patterns that actually work in real trading, and how to use them correctly.

What Are Candlestick Patterns?
Candlestick patterns represent price behavior and trader psychology during a specific time period.
Each candlestick shows:
- Open price
- High price
- Low price
- Close price
Patterns form when multiple candles appear together and reflect:
- Buyer strength
- Seller pressure
- Market indecision
- Possible reversal or continuation
Candlestick patterns do not predict the future. They show probability based on past behavior.
Why Most Candlestick Patterns Fail for Beginners
Before learning which patterns work, you must understand why most fail.
Common reasons:
- Used without trend direction
- Ignoring support and resistance
- Trading every pattern blindly
- No confirmation
- No risk management
Candlestick patterns work only when market context supports them.
Candlestick Patterns That Actually Work
Below are the most reliable candlestick patterns used by professional traders. These patterns work because they reflect strong market psychology.
1. Pin Bar (Hammer & Shooting Star)
The Pin Bar is one of the most powerful candlestick patterns that work in real trading.
Bullish Pin Bar (Hammer)
- Long lower wick
- Small body near top
- Shows strong buying rejection
Best used:
- At support
- After a down move
- With volume confirmation
Bearish Pin Bar (Shooting Star)
- Long upper wick
- Small body near bottom
- Shows strong selling pressure
Best used:
- At resistance
- After an up move
2. Engulfing Pattern (Bullish & Bearish)
The Engulfing pattern shows a strong shift in market control.
Bullish Engulfing
- Large green candle fully covers previous red candle
- Buyers overpower sellers
Works best:
- At support
- After a pullback
- In uptrend
Bearish Engulfing
- Large red candle covers previous green candle
- Sellers take control
Works best:
- At resistance
- In downtrend
This is one of the most reliable candlestick patterns that work when used with trend.
3. Inside Bar (Continuation Pattern)
The Inside Bar represents consolidation before a move.
Characteristics:
- Smaller candle inside previous candle
- Shows market pause
Best used:
- In strong trends
- After breakout or pullback
- With breakout confirmation
Inside bars work best as continuation patterns, not reversals.
4. Morning Star & Evening Star
These are three-candle reversal patterns.
Morning Star (Bullish)
- Strong down candle
- Small indecision candle
- Strong bullish candle
Works best:
- At strong support
- After a downtrend
Evening Star (Bearish)
- Strong up candle
- Small indecision candle
- Strong bearish candle
These patterns show clear shift in sentiment, which is why they work.
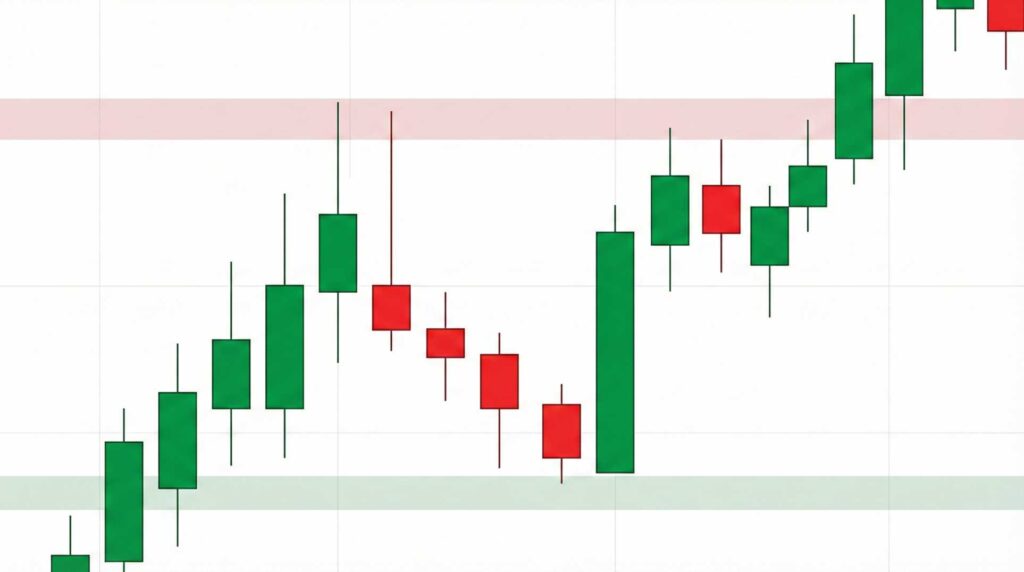
5. Breakout Candle (Strong Momentum Candle)
Not every pattern has a name. Sometimes, a strong breakout candle is the best signal.
Characteristics:
- Large candle body
- High volume
- Breaks support or resistance
Real use:
- Enter on retest
- Avoid chasing breakouts
- Use previous resistance as support
Breakout candles work because they show institutional participation.
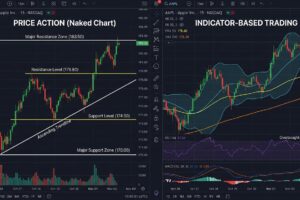
How to Use Candlestick Patterns Correctly (Real Use)
Candlestick patterns that work follow rules, not guesswork.
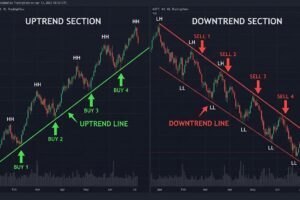
Step 1: Identify Market Context
- Trend direction
- Support and resistance
- Range or breakout market
Step 2: Wait for Pattern at Right Location
- Support
- Resistance
- Trend pullback
Step 3: Confirmation
- Volume
- Break of candle high/low
- Next candle direction
Step 4: Risk Management
- Stop loss below/above structure
- Fixed risk per trade
- Logical targets
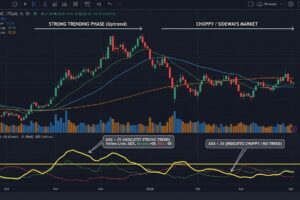
Best Timeframes for Candlestick Patterns
Candlestick patterns work better on:
- 15-minute
- 1-hour
- Daily charts
Lower timeframes:
- More noise
- More false signals
Higher timeframes:
- More reliability
- Less emotional pressure
Candlestick Patterns That Do NOT Work Alone
Avoid using patterns alone without context:
- Doji everywhere
- Random hammers
- Single candle reversals in strong trend
Patterns without context increase false signals.
Common Beginner Mistakes With Candlestick Patterns
- Memorizing too many patterns
- Trading every pattern
- Ignoring trend direction
- No stop loss
- Expecting 100% accuracy
Even the best candlestick patterns fail sometimes.
Can Candlestick Patterns Be Used Alone?
No. Candlestick patterns should be combined with:
- Support and resistance
- Trend analysis
- Volume
- Risk management
This combination improves probability.
For official stock market education and trading basics, visit the official NSE website.
Reality Check for Beginners
Candlestick patterns:
- Do not predict future
- Do not guarantee profit
- Do not work every time
They work as decision-making tools, not signals.
Final Conclusion
The candlestick patterns that work are not the ones with fancy names, but the ones that clearly show rejection, control shift, and momentum, used at the right location.
Focus on a few reliable patterns:
- Pin Bar
- Engulfing
- Inside Bar
- Star patterns
- Strong breakout candles
Use them with trend, levels, and risk management. That is how professional traders use candlestick patterns in real markets.