Of all the tools in technical analysis, the trendline is the most fundamental. No indicator, no algorithm, no complex system replaces the simple power of a well-drawn trendline on a clean chart. It is the first thing professional traders look for and the last thing they abandon.
Yet most beginners draw trendlines incorrectly, validate breakouts too eagerly, and end up getting trapped in false moves that reverse immediately after they enter.
The difference between a trader who profits from trendlines and one who gets repeatedly faked out is not luck. It is understanding — understanding how to draw trendlines correctly, how to validate that a breakout or reversal is genuine, and how to manage the trade once inside it.
This article covers everything you need to know about trendline trading — from the basics of correct drawing technique to the precise criteria for validating breakouts and reversals on Indian stocks and Nifty.
What Is a Trendline and Why Does It Matter?
A trendline is a straight line drawn on a price chart that connects two or more significant price points — either highs or lows — to visually represent the direction and slope of a trend.
Trendlines matter because they represent zones where buying or selling pressure has repeatedly appeared in the past. When price returns to a trendline, the same forces that created the previous turning points are likely to be active again — making trendlines genuinely predictive of future price behavior in a way that many indicators are not.
More importantly — trendlines represent the market’s own structure. Unlike a moving average or RSI which applies a mathematical formula to price — a trendline simply connects the market’s own significant turning points. It shows you what the market itself has done, not what a formula calculates about it.
This is why trendlines remain relevant across all timeframes, all markets, and all trading styles — from 5-minute Nifty scalping to weekly positional trades on individual stocks.
The Two Types of Trendlines
Uptrend Line (Support Trendline)
An uptrend line is drawn by connecting two or more rising swing lows — points where price reversed upward after a pullback. The line slopes upward from left to right.
This line represents dynamic support in an uptrend. Each time price pulls back to this line, buyers have previously stepped in and pushed price higher. The trendline marks the zone where buying pressure is expected to return.
Key principle: In an uptrend, price makes higher highs and higher lows. The uptrend line connects the higher lows — the ascending floor beneath price.
Downtrend Line (Resistance Trendline)
A downtrend line is drawn by connecting two or more falling swing highs — points where price reversed downward after a bounce. The line slopes downward from left to right.
This line represents dynamic resistance in a downtrend. Each time price bounces up to this line, sellers have previously stepped in and pushed price lower. The trendline marks the zone where selling pressure is expected to return.
Key principle: In a downtrend, price makes lower highs and lower lows. The downtrend line connects the lower highs — the descending ceiling above price.

How to Draw Trendlines Correctly — The Rules Most Traders Ignore
Incorrect trendline drawing is the root cause of most trendline trading failures. Here are the exact rules for drawing valid trendlines.
Rule 1 — Connect Swing Points, Not Random Price Points
A trendline must connect significant swing highs or swing lows — not arbitrary points on the chart. A swing low is a candle that has a higher low on both sides of it. A swing high is a candle that has a lower high on both sides.
Many beginners draw trendlines by connecting any two points that form a line they like. This produces meaningless lines that the market has no reason to respect. Only lines connecting genuine swing points carry analytical weight.
Rule 2 — Two Points Create a Trendline, Three Points Validate It
You need a minimum of two swing points to draw a trendline. But a trendline drawn through only two points is unconfirmed — it is a hypothesis, not a validated level.
When price returns to the trendline a third time and respects it — bouncing upward from an uptrend line or reversing downward from a downtrend line — the trendline is validated. Three touches transform a hypothesis into a significant analytical level.
The more times price touches and respects a trendline without breaking it — the more significant that trendline becomes. A trendline with 5 validated touches is far more important than one with only 2.
Rule 3 — Use Candle Bodies, Not Wicks, for Primary Drawing
This is the rule most beginners get wrong. They try to connect the exact tips of candle wicks — and then find that price constantly penetrates their trendline slightly without actually breaking it.
Professional trendline drawing primarily uses candle bodies — the open and close prices — rather than the extreme wick highs and lows. Wicks represent temporary price spikes — often driven by stop hunting or brief liquidity grabs — that do not reflect genuine support and resistance levels.
Draw your trendline through the bodies of the relevant candles. Allow wicks to slightly penetrate the line without treating every wick touch as a line break.
Rule 4 — The Angle Matters
A trendline that is too steep — rising or falling at more than 45 degrees — is unsustainable. Steep trendlines break frequently and are unreliable for trade planning purposes.
The most reliable trendlines have a moderate, sustainable slope. Shallow-angle trendlines with gradual slopes tend to last longer and produce more reliable touches than steep ones.
When a trendline becomes too steep — typically after a parabolic price move — expect it to break and prepare for a new, less steep trendline to form after the correction.
Rule 5 — Higher Timeframe Trendlines Carry More Weight
A trendline drawn on the weekly chart is significantly more important than one drawn on the 15-minute chart. Higher timeframe trendlines have been built over longer periods with more market participants contributing to their formation.
When a trendline from the weekly or daily chart coincides with a lower timeframe signal — that confluence dramatically increases the probability of a valid reaction.
Validating Trendline Breakouts — The Four Confirmation Criteria
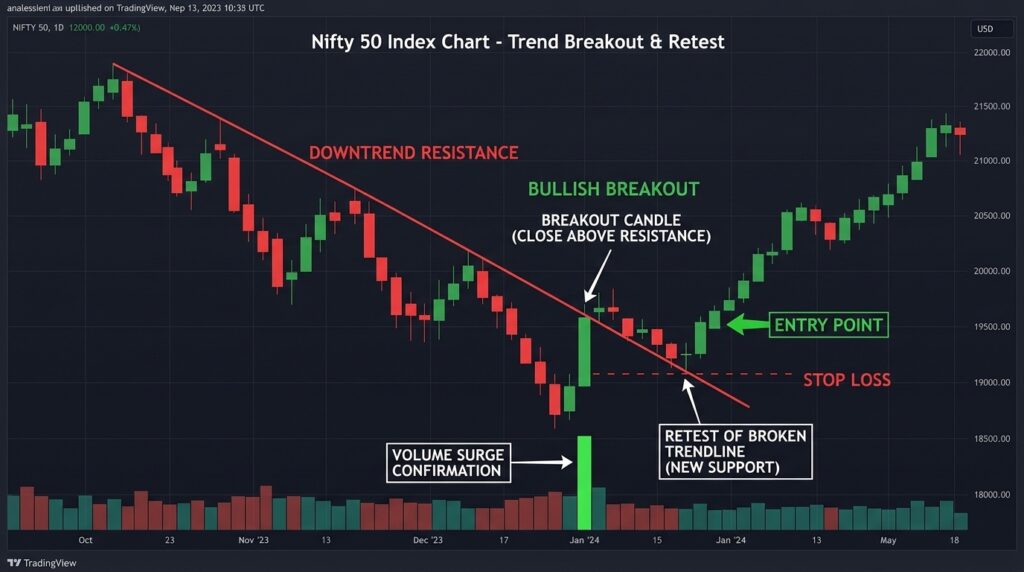
A trendline breakout — where price moves through and closes beyond the trendline — is one of the most powerful signals in technical analysis. But false breakouts are extremely common, especially on lower timeframes.
These four criteria help you distinguish genuine breakouts from false ones.
Criterion 1 — Candle Close Beyond the Trendline
Price must close on the other side of the trendline — not just touch it or spike through it intraday. An intraday penetration that closes back on the original side of the trendline is not a breakout. It is a wick.
For a bullish breakout of a downtrend line — you need a candle to close above the line. For a bearish breakdown of an uptrend line — you need a candle to close below it.
The close is the market’s final verdict for that time period. It is the only price that matters for trendline validation.
Criterion 2 — Volume Expansion on Breakout
Genuine trendline breakouts are accompanied by significantly above-average volume. Volume is the fuel of genuine directional moves — it represents the participation of real buying or selling pressure, not just price movement in a vacuum.
A breakout candle with volume 1.5× to 2× above the 20-period average is a strong confirmation signal. A breakout candle with below-average volume is a serious warning — the move may lack the participation needed to sustain itself and has high probability of being a false breakout.
Criterion 3 — The Retest and Hold
After a genuine breakout, price frequently returns to the broken trendline level — now from the opposite side — and uses it as the new support or resistance before continuing in the breakout direction.
This retest-and-hold pattern is one of the most reliable confirmation signals in all of technical analysis. A downtrend line that was resistance becomes support after a bullish breakout. An uptrend line that was support becomes resistance after a bearish breakdown.
Waiting for the retest-and-hold before entering gives you a much higher probability entry than chasing the initial breakout candle — with a tighter, more logical stop loss placement.
Criterion 4 — Momentum Confirmation
Use RSI or MACD to confirm that momentum is genuinely shifting in the breakout direction.
For a bullish trendline breakout — RSI should be crossing above 50 and ideally heading toward 60 or higher. MACD should be crossing above its signal line or already above it.
For a bearish breakdown — RSI crossing below 50 and MACD crossing below signal line confirm genuine momentum shift.
When price breaks a trendline but momentum indicators show divergence — RSI making a lower high while price makes a higher high — treat the breakout with significant caution.
Trading Trendline Reversals — When Price Bounces From the Line
A trendline reversal trade is taken when price returns to a validated trendline and bounces from it — continuing in the original trend direction rather than breaking through.
This is a trend-continuation trade — you are buying the dip in an uptrend or selling the bounce in a downtrend at a high-probability level.
How to Trade a Trendline Reversal
Step 1 — Identify a validated trendline with at least three confirmed touches on the daily or higher timeframe.
Step 2 — Wait for price to return to the trendline during a pullback in an uptrend or a bounce in a downtrend.
Step 3 — Look for a reversal candlestick pattern at the trendline — a hammer, bullish engulfing, or pin bar on an uptrend line confirms buying pressure returning. A shooting star, bearish engulfing, or pin bar on a downtrend line confirms selling pressure returning.
Step 4 — Enter on the close of the reversal candle or open of the following candle. The reversal candle itself is your confirmation that the trendline is holding.
Step 5 — Place stop loss just beyond the trendline — for an uptrend line touch, place stop below the trendline level. If price closes below the trendline — your thesis is wrong and the stop protects your capital.
Step 6 — Target the previous swing high for an uptrend reversal trade or previous swing low for a downtrend reversal trade. Risk-reward of minimum 1:2 should be achievable — if it is not, skip the trade.
Trendline Trading on Nifty — Specific Observations
Nifty 50 produces some of the cleanest trendline setups in Indian markets because it is driven by large institutional participants who create sustained, orderly trending moves that respect technical levels reliably.
Nifty Intraday Trendlines
On 5-minute and 15-minute Nifty charts — trendlines drawn from the opening range establish the intraday trend direction. A 15-minute uptrend line connecting the morning session lows becomes a key support level for intraday long trades throughout the session.
Key observation for Nifty intraday: The first trendline touch after the opening 30 minutes is often the most reliable. The market is finding its direction for the day and the first trendline reaction reflects genuine institutional order flow rather than random noise.
Nifty Daily Trendlines
On the daily Nifty chart — major trendlines often persist for months. A daily uptrend line connecting significant monthly lows becomes a major support level that triggers strong buying responses each time it is approached.
When a major daily Nifty trendline breaks with strong volume — it often signals a significant trend change that persists for weeks. These breakdowns are among the most reliable signals in Indian market technical analysis.
Nifty Weekly Trendlines
Weekly trendlines on Nifty represent multi-month to multi-year structural levels. Breaks of weekly trendlines with strong volume have historically marked the beginning of major bull or bear market phases in Indian markets.
For positional traders — monitoring weekly Nifty trendlines provides the highest-conviction signals with the clearest risk definition.
Channel Trading — Two Trendlines Working Together
A price channel is formed when you draw a second trendline parallel to your primary trendline — creating upper and lower boundaries that contain price movement.
Ascending Channel: Rising support trendline at the bottom, parallel rising resistance trendline at the top. Price bounces between the two lines in an orderly uptrend.
Descending Channel: Falling resistance trendline at the top, parallel falling support trendline at the bottom. Price moves between the two in an orderly downtrend.
Channel trading strategy is simple and powerful:
In an ascending channel — buy near the lower support trendline, target the upper resistance trendline. Stop loss just below the lower trendline.
In a descending channel — sell near the upper resistance trendline, target the lower support trendline. Stop loss just above the upper trendline.
When price breaks out of a channel — either above the upper trendline in an ascending channel or below the lower trendline in a descending channel — it signals potential acceleration of the trend or a trend change. Trade the breakout with the criteria discussed above.
Fan Lines — Advanced Trendline Technique
When a steep trendline breaks, price does not always reverse immediately. Often it simply slows down and forms a new, less steep trendline. This sequence — first trendline breaks, second less-steep trendline forms, second breaks, third forms — is called a trendline fan.
The fan pattern is important because the third trendline in the fan sequence is often the final support or resistance before a genuine trend reversal. When the third fan line breaks — with volume confirmation — it is one of the strongest reversal signals in trendline analysis.
On Nifty and large-cap Indian stocks during major corrections — fan line sequences appear regularly and provide early warning of trend exhaustion.
Common Trendline Trading Mistakes
Mistake 1 — Forcing Trendlines
Not every chart has a clear trendline. Many beginners force a line through points that do not genuinely form a meaningful trend. If you have to significantly adjust a line to touch three points — those points are not forming a real trendline. Wait for clearer structure.
Mistake 2 — Entering on the First Touch
The first touch of a newly drawn trendline is unconfirmed — the trendline has only two points and has not been validated. Entering a trade on the first touch after drawing the line is anticipating validation rather than waiting for it.
Mistake 3 — Chasing Breakouts Without Retest
Entering a trade immediately on the breakout candle — without waiting for a retest — means entering at the worst possible price with the widest stop loss. Patient traders who wait for the retest-and-hold get better entries with tighter stops and better risk-reward ratios.
Mistake 4 — Ignoring Volume on Breakouts
A breakout without volume is a warning, not a signal. Volume confirms participation. No volume — no conviction — no trade.
Mistake 5 — Moving the Trendline to Fit Price
Once drawn correctly through genuine swing points — do not move a trendline simply because price slightly penetrates it. Wick penetrations without body closes are not breaks. Do not redraw the line to accommodate every intraday spike or you will end up with a line that follows price rather than one that defines structure.

A Complete Trendline Trading Checklist
Use this checklist before every trendline-based trade:
Drawing Validation: Does the trendline connect genuine swing highs or lows? Does it have a minimum of three confirmed touches? Is the slope moderate and sustainable? Are touches based on candle bodies rather than just wicks?
Breakout Validation: Did the candle close beyond the trendline? Was volume above the 20-period average on the breakout candle? Did price retest the broken trendline and hold? Do momentum indicators confirm the breakout direction?
Reversal Validation: Is this a trendline with minimum three confirmed touches? Is there a reversal candlestick pattern at the trendline touch? Is the broader trend still intact on the higher timeframe?
Trade Setup: Is stop loss placed logically just beyond the trendline? Is the risk-reward ratio minimum 1:2? Is position size calculated based on stop loss distance and 1% account risk?
If all boxes are checked — you have a validated trendline trade setup with high probability and defined risk.
Final Thoughts
Trendline trading is not about drawing lines on charts. It is about reading the market’s own structure — understanding where buying and selling pressure has repeatedly appeared, and positioning yourself to benefit when those same forces activate again.
The traders who master trendlines are not doing anything magical. They are simply reading price behavior with clarity — identifying the levels where the market itself has shown its hand — and trading those levels with discipline and defined risk.
Draw your lines correctly. Wait for three touches before trusting them. Validate every breakout with volume and a retest. Manage reversals with candlestick confirmation at the line.
Do these things consistently — and trendlines will become the most reliable tool in your entire trading approach.