Most traders in India follow the same painful path. They learn a strategy — from YouTube, a course, or a book. They feel confident about it. They put real money into the market. They lose. They blame the strategy, find a new one, repeat the cycle.
What was missing in every single one of those attempts was one step that professional traders never skip:
Backtesting.
Backtesting is the process of testing a trading strategy on historical price data to see how it would have performed before risking a single rupee of real capital. It is the difference between trading a strategy you hope works and trading a strategy you know works — based on evidence, not belief.
And the best part for Indian retail traders in 2026: the most powerful backtesting tools available are completely free.
This article explains exactly what backtesting is, why it is non-negotiable for serious traders, how to do it correctly using free tools like TradingView, and the common mistakes that make backtesting results meaningless.
What Is Backtesting and Why Does It Matter?
Backtesting means applying your trading strategy’s entry and exit rules to historical price data and recording what would have happened — trade by trade — if you had been trading that strategy in the past.
The purpose is to answer four critical questions before you risk real money:
Does this strategy have a positive edge? Over a large sample of historical trades — does it win more than it loses, or does its average winner outsize its average loser, or both?
What is the realistic win rate? Not the win rate claimed by whoever taught you the strategy — but the actual win rate on real historical data in real market conditions.
What is the maximum drawdown? What is the worst losing streak the strategy has historically produced? Can you psychologically and financially survive that drawdown if it happens again?
What are the realistic expectancy and returns? If you risk 1% per trade with this strategy’s historical win rate and average risk-reward ratio — what monthly and annual returns are mathematically possible?
Without answers to these four questions — you are trading blind. With them — you trade with genuine confidence based on evidence.
The Two Types of Backtesting
Manual Backtesting
Manual backtesting means going through historical charts bar by bar — candle by candle — identifying your setup criteria, recording hypothetical trades, and calculating results by hand or in a spreadsheet.
This is slower than automated backtesting but has significant advantages for retail traders:
It forces you to deeply understand your own strategy — because you must apply every rule to every historical situation and make judgment calls about ambiguous setups.
It builds pattern recognition — hours of reviewing historical charts train your eyes to identify setups quickly and accurately.
It is available on free platforms — no coding knowledge required.
For most retail Indian traders — manual backtesting on TradingView is the recommended starting approach.
Automated Backtesting
Automated backtesting uses code to apply strategy rules mechanically to historical data — producing results instantly across thousands of bars without human involvement.
On TradingView this is done through Pine Script — the platform’s proprietary coding language. On other platforms it requires Python, AmiBroker, or other programming environments.
Automated backtesting is faster and removes human subjectivity from the process — but it also requires coding knowledge and can produce misleadingly optimistic results if done incorrectly.
For beginners — start with manual backtesting. Transition to automated backtesting once you have a thorough understanding of your strategy and its nuances.

TradingView — The Best Free Backtesting Tool for Indian Traders
TradingView is the most widely used charting and analysis platform in the world — and its free tier offers everything a retail Indian trader needs to conduct thorough manual backtesting.
Why TradingView for Backtesting
Free access to extensive historical data — TradingView’s free plan provides access to years of historical daily data on NSE stocks, Nifty, Bank Nifty, and virtually all Indian instruments. This gives you the historical sample size needed for meaningful backtesting.
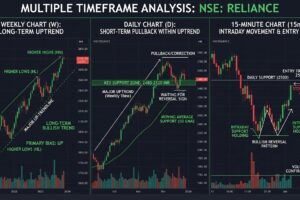
Bar Replay Feature — TradingView’s Bar Replay tool is the single most valuable feature for manual backtesting. It allows you to rewind any chart to a specific date in the past and then advance through history one bar at a time — simulating real-time trading on historical data. You see only the information that would have been available at that point in time — exactly as if you were trading live.
All indicators available — Every indicator you use in live trading — RSI, MACD, Bollinger Bands, ADX, moving averages — is available on historical data during replay. You can see exactly how your indicators looked at every historical signal point.
Clean interface — TradingView’s chart interface makes it easy to mark entries, exits, and key levels directly on the chart during a backtesting session.
Multiple markets — All NSE equity stocks, Nifty 50, Bank Nifty, Nifty midcap indices, currency pairs, and commodities are available — allowing you to backtest on the exact instruments you trade.
TradingView Free vs Paid for Backtesting
The free TradingView plan has some limitations relevant to backtesting:
Limited historical bars on intraday timeframes — the free plan provides limited intraday history which may restrict backtesting on 5-minute or 15-minute charts. Daily chart history is extensive even on the free plan.
One chart layout at a time — the free plan limits you to one active chart layout, which is sufficient for basic backtesting.
For most beginner to intermediate backtesting needs — the free TradingView plan is completely adequate. A TradingView Pro subscription is useful but not necessary to start.
How to Do Manual Backtesting on TradingView — Step by Step
Here is the complete process for conducting a meaningful manual backtest on TradingView.
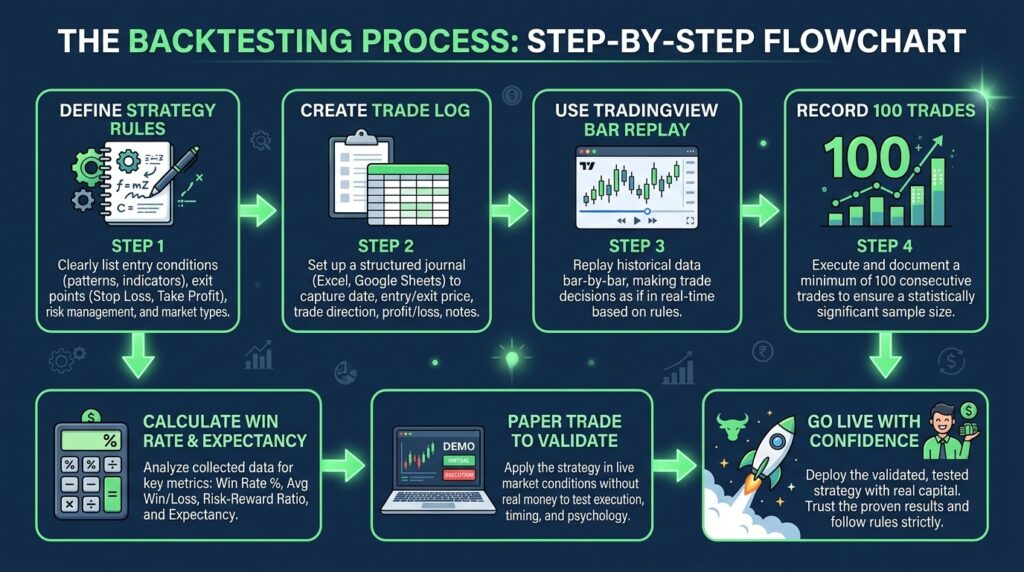
Step 1 — Define Your Strategy Rules Completely and Precisely
Before opening TradingView — write down every rule of your strategy in precise, unambiguous language. This is the most important step and the one most traders skip.
Your strategy document should specify:
Entry criteria — Every condition that must be met before you enter a trade. Not vague descriptions — precise conditions. For example: “Price must close above the 20-period Bollinger Band upper line on the daily chart. Volume on the breakout candle must be above the 20-day average. ADX must be above 25. Plus DI must be above Minus DI.”
Stop loss rule — Exactly where the stop loss is placed on every trade. “Stop loss placed at the 20-period moving average at the time of entry” or “Stop loss placed at 2× ATR below entry” — specific and mechanical.
Exit rules — Both profit target (if using fixed targets) and trailing stop rules. When exactly do you exit a winning trade? When exactly do you exit beyond the stop loss?
Timeframe — Which chart timeframe triggers entries?
Instruments — Which stocks or indices does this strategy apply to?
If you cannot write down every rule precisely — your strategy is not defined well enough to backtest. The act of writing the rules precisely will often reveal ambiguities you did not know existed.
Step 2 — Create Your Backtesting Log
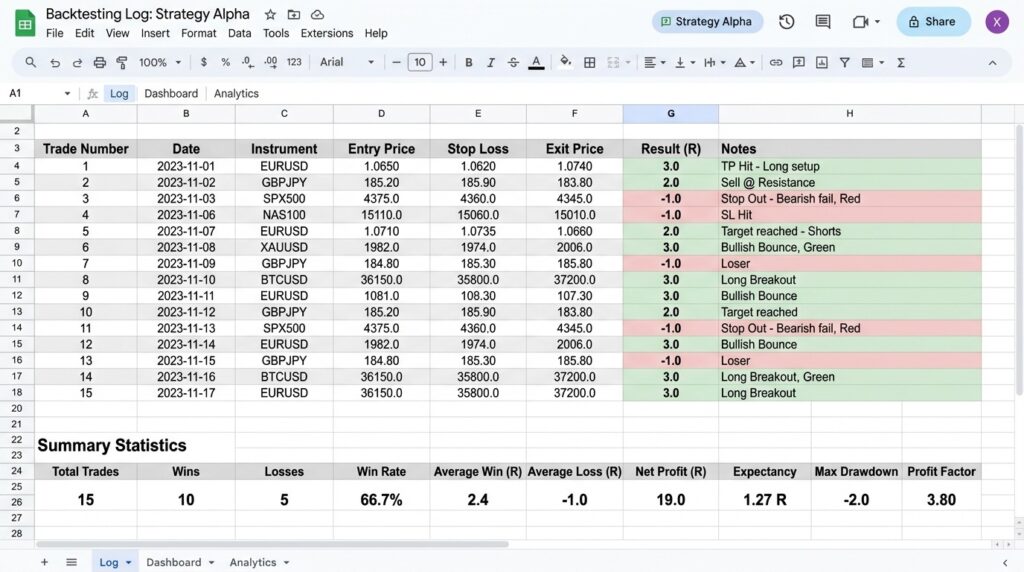
Before starting the backtest — create a spreadsheet in Google Sheets or Excel with these columns:
| Trade # | Date | Instrument | Entry Price | Stop Loss | Target | Exit Price | Result (R) | Reason for Entry | Notes |
|---|
The Result (R) column is particularly important. Express results in R-multiples — where 1R equals the amount you risked on the trade. A trade that hit a 2× target returns +2R. A trade stopped out returns -1R. This standardizes results regardless of position size and makes mathematical analysis easier.
Step 3 — Select Your Backtesting Period
Choose a historical period of at least 6 months — preferably 12 months or longer — that includes different market conditions. Your backtest should cover:
- A trending bull market phase
- A trending bear market phase or sharp correction
- A sideways, choppy consolidation period
Testing a strategy only on historical bull market data — when almost everything was going up — produces misleadingly positive results. A valid backtest includes the full range of market conditions.
For Indian traders — a backtest covering the period from January 2022 through December 2023 captures a sharp correction (early 2022), recovery, and various market conditions that represent realistic trading environments.
Step 4 — Use TradingView Bar Replay
Open your chosen instrument on TradingView. Apply your strategy’s indicators to the chart. Then:
Click the Bar Replay button (the clock icon in the top toolbar). Select your backtest start date by clicking on the chart at the beginning of your test period.
TradingView will now hide all price data after your selected date — showing you only the historical data up to that point, exactly as it would have appeared if you were trading live on that date.
Use the forward button to advance one bar at a time. At each bar — apply your strategy rules precisely as written. Ask: do my entry criteria apply on this bar? If yes — record the trade in your log. Continue advancing bar by bar, recording your hypothetical stop loss and target. Record the exit when it occurs.
Be disciplined. Do not use hindsight. If the rules say the setup is not there — do not record a trade even if you can see that price subsequently moved significantly. Your backtest is only valid if you apply the rules exactly as you would in live trading.
Step 5 — Record Every Trade Without Editing
Record every trade your rules generate — including the losing trades and the frustrating ones. Do not selectively record only the setups that worked. The purpose of backtesting is to measure the honest performance of your rules — not to create a record of your best ideas.
A common mistake is to retroactively decide that a certain historical setup “does not really count” because it had an unusual catalyst. This cherry-picking destroys the statistical validity of the backtest entirely.
Step 6 — Analyze Your Results After Minimum 50 Trades
Do not attempt to draw conclusions from fewer than 50 trades. Statistical significance in trading requires a large sample — 100 trades or more is ideal for reliable conclusions.
After 50 to 100 historical trades — calculate these metrics from your log:
Win Rate: Number of winning trades ÷ Total trades × 100
Average Winner (in R): Sum of all winning R-multiples ÷ Number of winning trades
Average Loser (in R): Sum of all losing R-multiples ÷ Number of losing trades (should be close to -1R if stop loss discipline was maintained)
Expectancy: (Win Rate × Average Winner) + (Loss Rate × Average Loser)
Maximum Consecutive Losses: The longest losing streak in the sample
Maximum Drawdown: The largest peak-to-trough decline in your running account equity during the test
Expectancy is the single most important metric. A positive expectancy means the strategy has a mathematical edge. A negative expectancy means it does not — regardless of how logical or elegant the strategy seems.
Other Free Backtesting Tools for Indian Traders
While TradingView is the recommended starting point — these additional free tools offer complementary capabilities.
Chartink — For Indian Market Screeners
Chartink is a free Indian market screener that allows you to create custom technical conditions and scan the entire NSE universe for stocks meeting those criteria on historical dates.
For backtesting — you can use Chartink to identify which stocks triggered your entry criteria on specific historical dates, then manually verify the subsequent price action on TradingView. This is particularly useful for equity traders who want to test strategies across the broad NSE universe rather than individual stocks.
URL: chartink.com — Free to use with registration.
NSE Historical Data Downloads — For Excel-Based Backtesting
The NSE official website provides free downloadable historical OHLCV (Open High Low Close Volume) data for all listed stocks and indices. This data can be downloaded as CSV files and imported into Excel or Google Sheets for systematic backtesting using formulas.
This approach requires more technical comfort with spreadsheets but gives you complete control over your data and calculations without any platform limitations.
URL: nseindia.com → Market Data → Historical Data
Zerodha Kite Charts — For Historical Reference
Zerodha Kite’s charting interface — available free to all Zerodha account holders — provides extensive historical data on all NSE instruments with clean chart presentation. While it lacks TradingView’s Bar Replay feature — it is useful for visually reviewing historical setups and supplement your TradingView backtesting.
Python With yfinance — For Automated Backtesting
For traders with basic Python knowledge — the yfinance library provides free access to historical price data for Indian stocks through Yahoo Finance. Combined with the Backtrader or Zipline backtesting framework — this allows fully automated strategy testing with detailed performance analytics.
This is the most powerful free backtesting option available but requires programming knowledge. It is not recommended for beginners but is worth noting for traders who develop coding skills over time.
The Critical Mistakes That Make Backtesting Results Meaningless
Backtesting is only valuable when done correctly. These mistakes produce results that look good on paper but fail completely in live trading.
Mistake 1 — Curve Fitting (Overfitting)
This is the most dangerous backtesting mistake. Curve fitting occurs when you adjust your strategy’s parameters repeatedly until they produce excellent historical results — without those parameters having genuine forward-looking validity.
Example: You test a moving average crossover strategy and find that a 17-period MA crossing the 43-period MA produced perfect results on Nifty in 2022. You did not derive these parameters from market logic — you searched through combinations until you found ones that fit the historical data.
These specific parameters will almost certainly fail in live trading because they were optimized for one specific historical period — not because of genuine market mechanics.
How to avoid it: Define your strategy parameters based on logic and market understanding — not historical optimization. Use round numbers (10, 20, 50, 200) that are widely used by market participants and therefore self-fulfilling. Test only the parameters you genuinely believe in before seeing the results.
Mistake 2 — Look-Ahead Bias
Look-ahead bias occurs when your backtest uses information that would not have been available at the time of the trade signal.
Example: You mark a trade entry on a candle because it formed a hammer — but you confirm it as a hammer only because you can see that price subsequently rallied from that level. At the time the candle was forming — you could not have known it would close as a hammer until the candle closed.
How to avoid it: Bar Replay on TradingView eliminates look-ahead bias by hiding future price data. When backtesting without Bar Replay — be extremely disciplined about only using information visible on the chart at the moment of the hypothetical trade entry.
Mistake 3 — Ignoring Transaction Costs
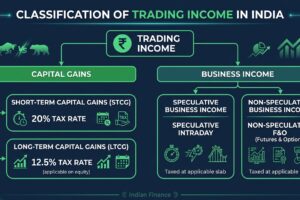
Every trade has a cost — brokerage, STT (Securities Transaction Tax), exchange fees, and slippage (the difference between the price you intended to trade and the price you actually get).
A strategy that shows 15% annual return before costs may show only 8% after realistic transaction costs are applied — particularly for high-frequency intraday strategies where costs compound rapidly.
How to avoid it: For every trade in your backtest — deduct realistic transaction costs. For intraday Nifty futures trades on Zerodha — total round-trip cost including brokerage and taxes is approximately ₹40 to ₹80 per lot. Factor this into every trade’s result.
Mistake 4 — Insufficient Sample Size
Drawing conclusions from 15 or 20 historical trades is statistically meaningless. With a small sample, random variation dominates the results — a 15-trade sample could show a 70% win rate purely by chance even for a strategy with a genuine 50% win rate.
How to avoid it: Minimum 50 trades — ideally 100 or more — before drawing any conclusions about strategy performance. If your strategy only generates 5 signals per month on daily charts — you need at least 10 to 20 months of historical data to get a meaningful sample.
Mistake 5 — Testing Only in Favorable Conditions
Testing a trend-following strategy only during strong trending markets produces excellent results that will not repeat when the market enters a prolonged sideways phase.
How to avoid it: Deliberately include different market regimes in your test period. Identify a bull market period, a bear market period, and a sideways period in your historical data — and ensure your 100-trade sample includes signals from all three environments.
Mistake 6 — Not Accounting for Psychology in Live Trading
The most honest and technically perfect backtest still cannot account for one variable: how you will feel when the strategy is in a 6-trade losing streak.
A backtest might show a maximum of 8 consecutive losses. Intellectually you accept this. But when trade 5 of that losing streak happens in live trading with real money — the psychological pressure to abandon the strategy is enormous. Many traders do abandon it — at the exact worst moment, just before the strategy recovers.
How to account for it: Review your maximum consecutive loss figure from the backtest before going live. Mentally rehearse how you will respond to that losing streak. Commit in writing to trading through a drawdown equal to your backtested maximum before making any strategy changes.
Building Your Backtesting Practice — A 4-Week Plan
Week 1 — Strategy Definition Write your complete strategy rules document. Every entry condition, every stop loss rule, every exit rule. Show it to another trader and ask if they could apply your rules to a chart without asking you any questions. If they cannot — your rules are not specific enough. Refine until they are.
Week 2 — Template and Setup Create your backtesting log spreadsheet with all required columns. Open TradingView, practice using Bar Replay on a familiar stock. Run 10 practice trades on a strategy you understand well — just to become comfortable with the process before starting your real backtest.
Week 3 and 4 — Execute the Backtest Run your actual backtest targeting a minimum of 50 trades. Work through the historical data systematically — advancing bar by bar, applying rules precisely, recording every trade. Aim for 1 to 2 hours of backtesting per day.
After Week 4 — Analyze and Decide Calculate all performance metrics from your completed log. If expectancy is positive — proceed to paper trading to validate the results in current market conditions before going live. If expectancy is negative or marginal — identify which specific rule adjustments might improve it, make one change at a time, and retest.
From Backtesting to Paper Trading to Live Trading — The Correct Sequence
A positive backtest result does not mean you should immediately start live trading. The correct progression is:
Stage 1 — Backtest (Historical Data) Test on past data. Establish that the strategy has a positive expectancy over a large historical sample. Understand its characteristics — win rate, average winner, maximum drawdown, typical trade frequency.
Stage 2 — Paper Trade (Current Market, No Real Money) Apply the strategy in real time on current market conditions — but with simulated money. TradingView has a paper trading feature that simulates real account management. Paper trade for a minimum of 30 trading days — approximately 1 to 2 months — to validate that the strategy’s historical characteristics hold up in current market conditions.
Paper trading also gives you crucial psychological practice — the discipline of following rules in real time even when signals go against your instinct — without the financial consequences of live trading mistakes.
Stage 3 — Live Trading With Minimum Size After successful paper trading — go live with the smallest position size your strategy allows. For Nifty futures traders — one lot. For equity traders — the minimum number of shares that represents 1% account risk.
The transition from paper trading to live trading almost always reveals psychological challenges that paper trading obscured — because real money creates real emotions. Starting at minimum size keeps financial damage small while you develop live trading experience with your validated strategy.
Stage 4 — Scale Up Gradually Only after consistent execution over 30 to 50 live trades that match your backtested and paper-traded performance — begin increasing position size gradually toward your target size.
Final Thoughts
Backtesting is not glamorous. It does not produce instant profits. It requires discipline, patience, and hours of methodical work going through historical charts bar by bar.
But it is the single most important process that separates traders who eventually succeed from those who spend years and thousands of rupees cycling through strategies they hoped would work.
A strategy that has been rigorously backtested on 100 historical trades, validated through paper trading, and carefully brought to live markets — is not a hope. It is a tested, evidence-based approach with known characteristics that you can execute with genuine confidence.
That confidence — grounded in evidence rather than belief — is what allows you to take the next trade after three consecutive losses. It is what allows you to hold a position through normal adverse movement without panicking. It is what separates trading from gambling.
Start your first backtest this week. Use TradingView Bar Replay. Keep it simple. Apply your rules honestly. Record everything.
The work you do in backtesting will pay dividends in every live trade you take for the rest of your trading career.