Of all the indicators in technical analysis, few intimidate beginners more than the Ichimoku Cloud. Open any chart with Ichimoku applied and you see a confusing web of colored lines, shaded clouds, and Japanese terminology that looks nothing like the clean moving averages and RSI you are used to.
Most beginners look at it once and close the tab.
That is a mistake. Because the Ichimoku Cloud is not five separate complicated indicators layered on top of each other. It is one complete trading system — designed to show trend direction, momentum, support and resistance, and trade signals all in a single glance.
Once you understand each component individually and then see how they work together — Ichimoku becomes one of the clearest, most information-rich indicators available to any trader. And when applied across multiple timeframes — which is where its real power lies — it becomes a genuinely professional-grade trading tool.
This article explains every component of the Ichimoku Cloud in plain language, shows you exactly how to use it across multiple timeframes, and gives you a practical framework for applying it to Indian markets including Nifty and individual stocks.
The Origin of Ichimoku Cloud
Ichimoku Kinko Hyo — which translates roughly to “one glance equilibrium chart” — was developed by Japanese journalist Goichi Hosoda over three decades of research. He published it in 1969 after years of testing with the help of a large team of assistants performing manual calculations.
The name itself tells you the design philosophy: one glance at the chart should tell you everything you need to know about the current state of the market. Trend, momentum, support, resistance, and signal — all visible simultaneously without additional indicators.
This philosophy makes Ichimoku fundamentally different from most Western indicators, which each measure one specific thing. Ichimoku was built from the beginning as a complete system — not a component to be combined with other tools.
The Five Components of Ichimoku Cloud — Explained Simply
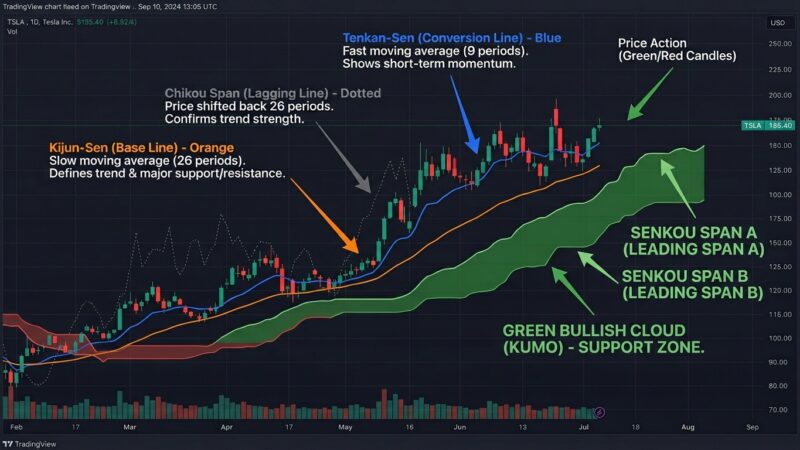
Component 1 — Tenkan-Sen (Conversion Line)
Calculation: (Highest High + Lowest Low) ÷ 2 over the last 9 periods
What it measures: The midpoint of price over the last 9 candles. Think of it as a fast-moving equilibrium line — similar in concept to a short-term moving average but calculated differently.
What it tells you: The Tenkan-Sen reflects short-term price momentum. When it is rising steeply — short-term momentum is bullish. When it is flat — momentum is neutral and the market is in consolidation. When falling — short-term momentum is bearish.
Visual: Displayed as a thin blue or red line depending on your platform settings.
Component 2 — Kijun-Sen (Base Line)
Calculation: (Highest High + Lowest Low) ÷ 2 over the last 26 periods
What it measures: The midpoint of price over the last 26 candles. A slower equilibrium line reflecting medium-term price behavior.
What it tells you: The Kijun-Sen is one of the most important lines in the entire Ichimoku system. It acts as a dynamic support and resistance level, a trend filter, and a trailing stop for active trades. When price is above the Kijun-Sen — medium-term trend is bullish. Below it — bearish.
Visual: Displayed as a thicker blue or orange line. Moves more slowly than the Tenkan-Sen.
Component 3 — Senkou Span A (Leading Span A)
Calculation: (Tenkan-Sen + Kijun-Sen) ÷ 2, plotted 26 periods AHEAD of current price
What it measures: The average of the two equilibrium lines — projected forward into the future by 26 periods.
What it tells you: Senkou Span A forms one boundary of the Ichimoku Cloud. When it is above Senkou Span B — the cloud is green (bullish). When below — the cloud is red (bearish). Because it is plotted ahead of current price, it shows you where future support and resistance is likely to exist before price gets there.
Component 4 — Senkou Span B (Leading Span B)
Calculation: (Highest High + Lowest Low) ÷ 2 over the last 52 periods, plotted 26 periods AHEAD
What it measures: The midpoint of the last 52 periods — a long-term equilibrium line projected forward.
What it tells you: Senkou Span B forms the second boundary of the cloud. It represents long-term equilibrium and acts as the stronger of the two cloud boundaries for support and resistance purposes. A thick cloud — large distance between Span A and Span B — indicates strong support or resistance. A thin cloud indicates weaker support or resistance that price may break through more easily.
Component 5 — Chikou Span (Lagging Span)
Calculation: Current closing price plotted 26 periods BEHIND current price
What it measures: Today’s price placed back in time by 26 periods — allowing direct visual comparison of current price to where price was 26 periods ago.
What it tells you: If the Chikou Span is above price from 26 periods ago — current bullish momentum is confirmed. If below — bearish momentum is confirmed. The Chikou Span is the confirmation component of Ichimoku. Many traders require Chikou Span confirmation before entering any trade.

The Ichimoku Cloud — Understanding the Most Visual Element
The Cloud — called Kumo in Japanese — is the shaded area between Senkou Span A and Senkou Span B. It is the most visually distinctive part of Ichimoku and the most important zone for support and resistance.
Green Cloud vs Red Cloud
When Senkou Span A is above Senkou Span B — the cloud is green. This indicates a bullish environment. Price is more likely to find support at the cloud top when approaching from above.
When Senkou Span A is below Senkou Span B — the cloud is red. This indicates a bearish environment. Price is more likely to find resistance at the cloud bottom when approaching from below.
Cloud Thickness Matters
A thick cloud represents strong support or resistance — price will likely struggle to penetrate it. When price enters a thick cloud, expect choppy, uncertain price action.
A thin cloud represents weak support or resistance — price may cut through it quickly. Thin cloud breakouts tend to be cleaner and faster than thick cloud breakouts.
Price Position Relative to Cloud
This is the single most important signal in all of Ichimoku:
Price above the cloud — Bullish. Only look for long trades.
Price below the cloud — Bearish. Only look for short trades.
Price inside the cloud — Neutral/uncertain. Avoid new trades. Wait for price to exit the cloud with direction before committing.
This simple three-state filter alone eliminates a massive number of low-probability trades and keeps you aligned with the dominant trend.
The Three Classic Ichimoku Signals
Signal 1 — TK Cross (Tenkan-Kijun Cross)
The TK Cross occurs when the Tenkan-Sen crosses the Kijun-Sen — similar in concept to a moving average crossover.
Bullish TK Cross: Tenkan-Sen crosses above Kijun-Sen. Strength depends on where this cross occurs relative to the cloud:
- Cross above the cloud — Strong bullish signal
- Cross inside the cloud — Neutral signal, lower reliability
- Cross below the cloud — Weak signal, trade with caution
Bearish TK Cross: Tenkan-Sen crosses below Kijun-Sen. Same strength gradations apply based on cloud position.
Signal 2 — Kijun Cross (Price-Kijun Cross)
The Kijun Cross occurs when price itself crosses the Kijun-Sen line.
Bullish Kijun Cross: Price crosses above the Kijun-Sen — indicates a shift in medium-term momentum to bullish.
Bearish Kijun Cross: Price crosses below the Kijun-Sen — indicates shift to bearish medium-term momentum.
The Kijun Cross is considered a stronger signal than the TK Cross because it involves actual price behavior crossing a key equilibrium level — not just two indicator lines crossing each other.
Signal 3 — Cloud Breakout (Kumo Breakout)
The Cloud Breakout occurs when price exits the cloud after being inside it — or crosses completely through the cloud from one side to the other.
Bullish Cloud Breakout: Price breaks above the top of the cloud with momentum. This is the strongest bullish signal in Ichimoku — especially when accompanied by Chikou Span confirmation and a green cloud forming ahead.
Bearish Cloud Breakout: Price breaks below the bottom of the cloud. Strongest bearish signal — especially with Chikou Span below historical price and red cloud ahead.
Cloud breakouts on the daily chart of Indian stocks and Nifty often mark the beginning of significant trending moves lasting weeks to months.
Multi-Timeframe Ichimoku — Where the Real Power Lies
Using Ichimoku on a single timeframe gives you useful information. Using it across multiple timeframes gives you a complete picture of market structure from macro to micro — and dramatically improves the probability of every trade you take.
The multi-timeframe approach works on a simple principle: higher timeframe sets the direction, lower timeframe provides the entry.
The Three-Timeframe Framework for Indian Traders
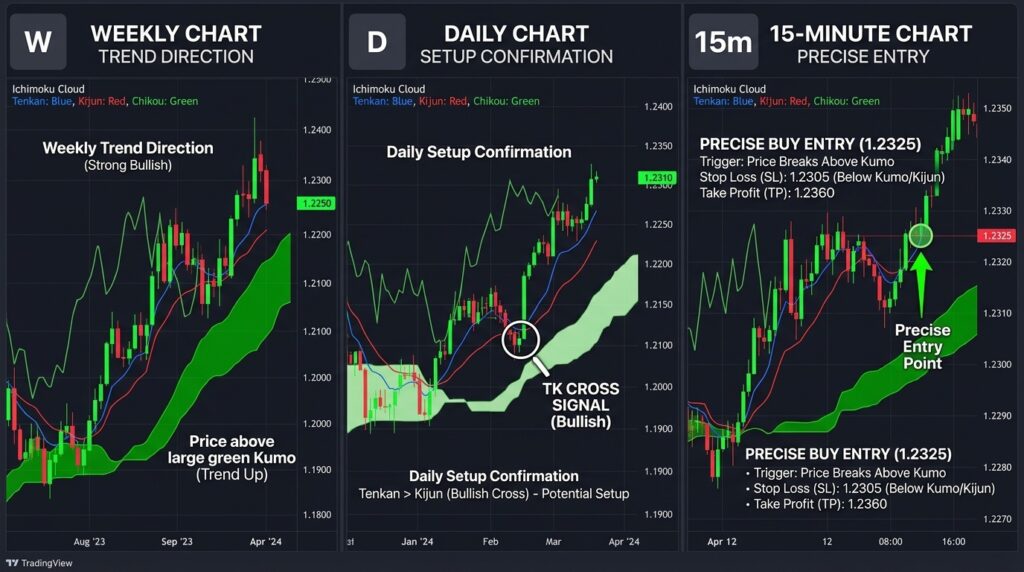
Timeframe 1 — Weekly Chart (Trend Identification)
The weekly Ichimoku chart tells you the dominant long-term trend. This is your highest authority signal.
Rule: Only trade in the direction of the weekly cloud. If price is above a green weekly cloud — only look for long trades on lower timeframes. If below a red weekly cloud — only look for shorts.
This single filter eliminates counter-trend trades — which are statistically lower probability — and keeps you aligned with institutional money flow.
Timeframe 2 — Daily Chart (Setup Identification)
The daily Ichimoku chart shows you the medium-term structure and identifies when a trade setup is developing.
On the daily chart, look for:
- Price position relative to cloud confirming weekly direction
- TK Cross or Kijun Cross signals forming
- Chikou Span clear of historical price — confirming momentum
The daily chart tells you when a high-probability setup exists and approximately when to prepare for entry.
Timeframe 3 — Hourly or 15-Minute Chart (Entry Timing)
The lower timeframe chart provides the precise entry signal within the context established by the higher timeframes.
On the 15-minute or hourly chart, look for:
- A TK Cross in the direction confirmed by daily and weekly
- Price breaking above or below the lower-timeframe cloud in the direction of the higher-timeframe trend
- Chikou Span confirming momentum on this timeframe
This entry is now triple-confirmed — aligned with weekly trend, validated by daily setup, and timed precisely on the lower timeframe.
Applying Multi-Timeframe Ichimoku to Nifty — Practical Example
Here is exactly how to apply the three-timeframe Ichimoku framework to Nifty 50 for intraday trading.
Step 1 — Weekly Nifty Chart Check
Open Nifty weekly chart with Ichimoku. Ask: Is price above or below the cloud?
Assume price is above a green cloud — weekly trend is bullish. Decision: Only look for long trades this week. No shorts regardless of intraday signals.
Step 2 — Daily Nifty Chart Setup
Open Nifty daily chart. Check:
- Is price above the cloud? ✅ Confirms bullish bias
- Is Tenkan-Sen above Kijun-Sen? ✅ Short-term momentum bullish
- Is Chikou Span above price from 26 days ago? ✅ Momentum confirmed
All three daily conditions met — a long setup is developing. Prepare for entry on lower timeframe.
Step 3 — 15-Minute Nifty Chart Entry
Open Nifty 15-minute chart. Wait for:
- Price to be above the 15-minute cloud ✅
- Tenkan-Sen to cross above Kijun-Sen on 15-minute chart ✅
- Chikou Span clear above historical price on 15-minute ✅
When all three conditions align on the 15-minute chart — enter long.
Stop Loss: Place at the Kijun-Sen level on the 15-minute chart. If price closes back below the 15-minute Kijun-Sen — exit the trade.
Target: First target at 1× the cloud thickness above entry. Trail stop to Kijun-Sen as trade moves in your favor.
This trade is now confirmed on three timeframes — significantly higher probability than any single-timeframe signal.
Default Ichimoku Settings — Should You Change Them?
The default Ichimoku settings — 9, 26, 52 — were originally calibrated for Japanese markets which traded 6 days a week. Some traders adjust these settings for 5-day trading week markets like India.
Adjusted settings for 5-day markets: 7, 22, 44
These adjusted numbers better reflect one trading week, one trading month, and two trading months respectively in Indian market structure.
However — the original 9, 26, 52 settings remain widely used globally and are what most professional traders reference. Because so many traders use the default settings — support and resistance levels generated by them become self-fulfilling to a degree.
Recommendation for beginners: Start with default settings 9, 26, 52. Once you understand the system thoroughly — experiment with 7, 22, 44 on Indian markets and compare results on historical charts before applying to live trading.
Ichimoku on Indian Stocks — Key Observations
Ichimoku works particularly well on highly liquid Indian large-cap stocks that trend cleanly. Stocks like Reliance Industries, TCS, Infosys, HDFC Bank, and Nifty 50 itself produce reliable Ichimoku signals because their price action is driven by large institutional participants who create sustained trending moves.
Small-cap and mid-cap stocks with lower liquidity tend to produce more false signals on Ichimoku because their price action is choppier and more easily manipulated by low volumes.
For beginners applying Ichimoku in Indian markets — restrict your analysis to Nifty 50 stocks and the Nifty index itself until you are fully comfortable with the system. These provide the cleanest signals and the most reliable cloud support and resistance levels.
Common Beginner Mistakes With Ichimoku
Mistake 1 — Using Every Signal Simultaneously
Ichimoku generates multiple signals at once — TK Cross, Kijun Cross, Cloud Breakout, Chikou confirmation. Beginners try to use all of them and become confused when they give conflicting information across timeframes. Start with one signal — the price-to-cloud relationship — and master it before adding others.
Mistake 2 — Trading Inside the Cloud
The cloud represents uncertainty. Price inside the cloud means the market has no clear direction. Many beginners see a TK Cross inside the cloud and enter — only to find price chopping back and forth. Rule: Never enter a new position while price is inside the cloud.
Mistake 3 — Ignoring the Chikou Span
The Chikou Span is the most commonly ignored component of Ichimoku — and one of the most important. Before any entry, check whether Chikou is clear of historical price bars. If Chikou is tangled in historical price — it indicates congestion ahead and lowers the probability of a clean move.
Mistake 4 — Using Ichimoku on Low-Liquidity Stocks
Ichimoku works on trending, liquid markets. Applying it to illiquid penny stocks or thinly traded small-caps produces unreliable signals. Always match the tool to the appropriate instrument.
Mistake 5 — Expecting Immediate Mastery
Ichimoku has more components than most indicators. Give yourself at least 30 to 60 days of chart study — looking at historical examples on TradingView — before trading it live. The pattern recognition for Ichimoku develops through visual familiarity over time, not through reading alone.

A Simple Ichimoku Checklist for Every Trade
Before entering any trade using Ichimoku — run through this checklist:
Weekly Chart: Is price above cloud? (Bullish) or below cloud? (Bearish) — This sets your directional bias for the week.
Daily Chart: Is price on the correct side of cloud matching weekly bias? Is Tenkan above Kijun for longs or below for shorts? Is Chikou Span clear of historical price?
Entry Timeframe (15-min or Hourly): Is price above or below cloud matching higher timeframe direction? Has a TK Cross or Kijun Cross formed in the correct direction? Is Chikou clear?
Trade Management: Stop loss placed at Kijun-Sen on entry timeframe. Exit if price closes back through Kijun-Sen against trade direction.
If all boxes are checked across all three timeframes — you have a high-probability Ichimoku trade setup. If any timeframe shows conflicting signals — wait for alignment before entering.
Final Thoughts
Ichimoku Cloud is not complicated once you understand what each component measures and why it was designed that way. It is a complete trading system built by someone who spent decades studying price behavior — and its longevity since 1969 reflects genuine analytical value.
For beginners, the most important thing is to start simple. Learn the cloud first — price above green cloud means bullish, price below red cloud means bearish. Master this one concept and apply it consistently for a month before adding the other components.
Then add the Kijun-Sen as your dynamic support and stop loss level. Then add multi-timeframe confirmation. Build your Ichimoku knowledge layer by layer — not all at once.
Applied with patience and proper multi-timeframe confirmation on liquid Indian instruments like Nifty and large-cap stocks — Ichimoku Cloud provides one of the most comprehensive single-indicator views of market structure available to any trader at any level.
One glance. Complete picture. That is the promise of Ichimoku — and for traders who take the time to learn it properly, it is a promise that delivers.